Phoenix Visibility Web Cameras
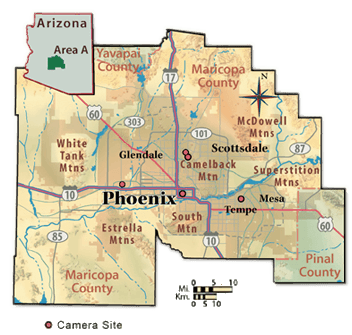
Map points are for location identification purposes only.
PhoenixVis.net brings you live pictures and corresponding air quality conditions from scenic urban and rural vistas in the Phoenix, Arizona region.
This page provides an overview of all Phoenix Visibility Web Cameras. In addition, near real-time air quality data provide visibility information to the public.
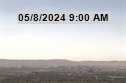
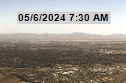
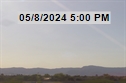
Digital images from Web-based cameras are updated every 5 minutes. Images will appear black during the nighttime hours for obvious reasons. If the image is missing, please be patient and try again later.
For more air quality information contact us at Arizona Department of Environmental Quality (ADEQ).
Current Views
-
 South Mountain is a rugged mountain south of metropolitan Phoenix. The view is from North Mountain looking toward the Phoenix downtown skyline and the South Mountains in the distance.
-
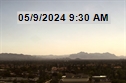
 The Sierra Estrellas form a jagged skyline southwest of metropolitan Phoenix. The camera view looks southwest from North Mountain.
-
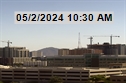
 The White Tank Mountains lie to the west of metropolitan Phoenix. The camera view looks west from Avondale.
-
 The distinctive profile of this inner city mountain gives it its name. It is bordered by the cities of Phoenix, Scottsdale and Paradise Valley. The view is from the Capital Mall area of downtown Phoenix looking northeast toward Camelback Mountain.
-
 The Superstition Mountains are part of the designated Superstition Wilderness Area. The view is looking east from downtown Mesa with the community of Apache Junction between the camera and the mountain vista.